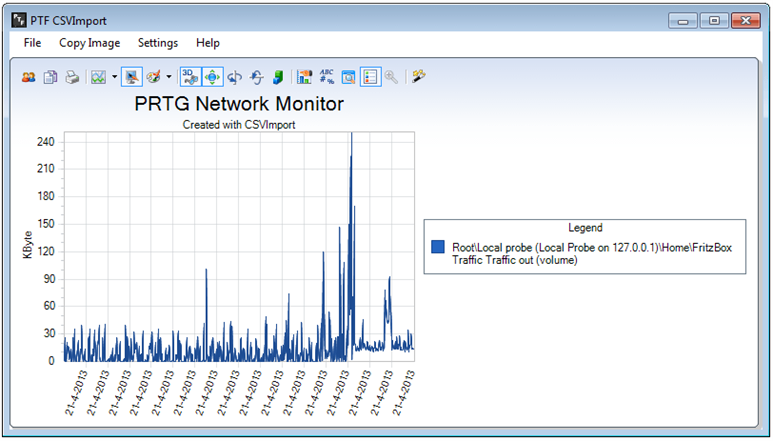
CSVImport was originally intended to build graphs from data that is exported using CSVExport, but it can also request data directly from your PRTG server.
Select the .csv files to use, or select some sensors from your PRTG server. Next select the channels you want to show in your graph and modify the graph to your whishes.
Select the .csv files to use, or select some sensors from your PRTG server. Next select the channels you want to show in your graph and modify the graph to your whishes.
CSVIMPORT
•
You can change the colors, rotate, tilt, zoom the graph and much more
•
You can choose from different graph types
•
Graphs can be printed or copied to the clipboard.